Gantt charts have been the default project timeline visualization since Henry Gantt introduced them over a century ago. Despite the rise of Kanban boards, sprint backlogs, and project management SaaS, Gantt charts persist because they answer a question no other format handles as cleanly: what happens when, and what depends on what?
This guide covers when Gantt charts add value, how to build them effectively, and the tools that make the process fast in 2026.
When Gantt Charts Are Worth the Effort
Gantt charts are most useful when a project has sequential dependencies, multiple parallel workstreams, and a fixed deadline. Construction projects, product launches, event planning, and software release cycles all fit this profile.
They’re less useful for ongoing work without clear end dates (support tickets, content calendars) or for highly iterative work where the plan changes daily (early-stage product development). In those cases, a Kanban board or a simple task list is lighter and more honest about the uncertainty.
The test is straightforward: if someone asks “when will this be done?” and the answer depends on which tasks finish before others can start, a Gantt chart is the right visualization.
Best Practices for Readable Gantt Charts
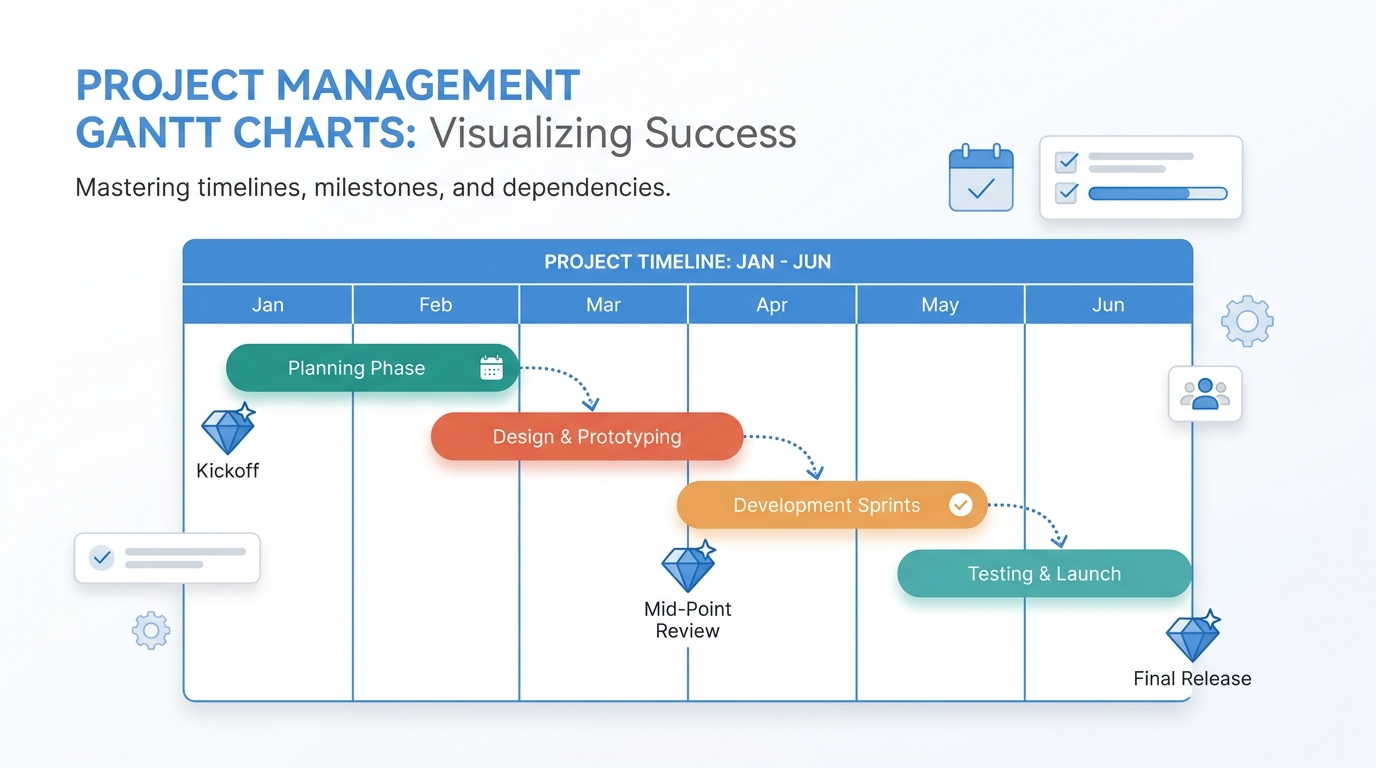
A Gantt chart with 200 tasks and 15 colors is worse than no chart at all. The goal is clarity, not comprehensiveness.
Keep the task list to 15-30 items for a single view. If your project has more, group tasks into phases or workstreams and show one level at a time. Expandable/collapsible hierarchy works in interactive tools; for a static image or slide, show the summary level only.
Use color to encode workstreams, not priority or status. Color should answer “which team owns this?” not “is this important?” Priority and status change frequently; team ownership doesn’t.
Show dependencies explicitly. The arrows between bars are the most valuable part of a Gantt chart. Without them, the chart is just a sideways bar chart with dates, which carries no more information than a table.
Mark milestones as diamonds, not bars. Milestones are zero-duration events (launch date, review deadline, go/no-go decision), and representing them as bars implies duration that doesn’t exist.
Tools for Building Gantt Charts
Dedicated project management tools like Microsoft Project, Asana, and Monday.com all include Gantt views. These are the right choice when the Gantt chart is a living document that the team updates daily, because the chart stays linked to the task data.
For one-time or periodic Gantt charts (a proposal timeline, a board presentation, a client-facing project plan), a dedicated charting tool is faster. A Gantt chart maker like ChartGen AI generates a clean Gantt chart from a task list in seconds. You describe the phases and dates, and the AI handles the layout, color coding, and export. The result looks polished enough for a slide deck without manual formatting.
Excel can technically produce Gantt charts using stacked bar charts with invisible segments, but the workaround is fragile and the result is hard to maintain. It’s a last resort, not a first choice.
Common Gantt Chart Mistakes
The most common mistake is over-detailing. A Gantt chart for a stakeholder audience should show 10-15 items, not 100. The project manager’s working Gantt chart can be detailed, but the one in the executive update should be a summary.
The second mistake is not updating the chart. A Gantt chart that shows the original plan but not the current reality is misleading. If your Gantt chart isn’t linked to live task data, schedule a weekly update or stop showing it.
The third mistake is ignoring the critical path. The critical path is the longest chain of dependent tasks that determines the earliest possible completion date. If you don’t know your critical path, the Gantt chart is decorative rather than analytical.
Conclusion
Gantt charts remain the clearest way to communicate a project timeline with dependencies. Keep them focused, keep them updated, and use the right tool for the job. For quick, professional Gantt charts that don’t require a project management subscription, AI-powered generators are the fastest path from task list to timeline.